There are two main types of fermentation, lactic acid fermentation, and alcoholic fermentation. The first, also known as lacto-fermentation, is responsible for foods such as sauerkraut when bacteria break down the sugar and turns it into lactic acid. Alcoholic fermentation is the breakdown of sugars by yeast, which is then converted into alcohol. By 2032, the global fermented food market is forecast to reach over 989 billion U.S. dollars.
Probiotics
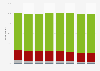
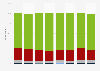
Although fermented foods have a long history, they have gained notoriety in recent years due to the health benefits associated with probiotics. Probiotics are microorganisms that can help the body, most notably by improving digestive function. Yogurt already has probiotics naturally present as a result of fermentation, but many companies are beginning to market their dairy products specifically for the probiotic benefits. The UK has one of the largest probiotic yogurt markets in Europe, exceeding one billion euros in 2021. Kefir is also a popular fermented dairy product with probiotics. Between 2022 and 2032, the global kefir market is forecast to grow by over 500 million U.S. dollars.U.S. fermented foods market
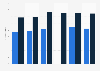
Fermented products are growing in popularity in the United States as consumers are becoming aware of the benefits of fermented products. In 2021, the U.S. fermented food and beverage market reached retail sales of just under 11 billion U.S. dollars. About 15 percent of consumers in the United States eat fermented foods to improve their digestive or gut health, while some consumers would also be interested in them as alternative protein sources. Kombucha is one of the leading fermented beverages in the U.S. market. The top kombucha brands in the U.S. were GTs, Health Ade, and Kevita as of 2022, but GTs far outperformed its competitors with almost triple the sales of Health Ade kombucha during that time period.